Flowmetering

Contents
Principles of Flowmetering
A detailed examination of the principles and terminology surrounding the topic of flowmetering, including accuracy, repeatability and turndown. Also included is a basic insight to Bernoulli's Theorem.
Terminology
When discussing flowmetering, a number of terms, which include Repeatability, Uncertainty, Accuracy and Turndown, are commonly used.
Repeatability
This describes the ability of a flowmeter to indicate the same value for an identical flowrate on more than one occasion. It should not be confused with accuracy i.e. its repeatability may be excellent in that it shows the same value for an identical flowrate on several occasions, but the reading might be consistently wrong (or inaccurate). Good repeatability is important, where steam flowmetering is required to monitor trends rather than accuracy. However, this does not dilute the importance of accuracy under any circumstances.
Uncertainty
The term ‘uncertainty’ is now becoming more commonly referred to than accuracy. This is because accuracy cannot be established, as the true value can never be exactly known. However ‘uncertainty’ can be estimated and an ISO standard exists offering guidance on this matter (EN ISO/IEC 17025).
It is important to recognise that it is a statistical concept and not a guarantee. For example, it may be shown that with a large population of flowmeters, 95% would be at least as good as the uncertainty calculated. Most would be much better, but a few, 5% could be worse.
Accuracy
This is a measure of a flowmeter’s performance when indicating a correct flowrate value against a ‘true’ value obtained by extensive calibration procedures. The subject of accuracy is dealt with in ISO 5725.
The following two methods used to express accuracy have very different meanings:
• Percentage of measured value or actual reading
For example, a flowmeter’s accuracy is given as ±3% of actual flow.
At an indicated flowrate of 1 000 kg/h, the ‘uncertainty’ of actual flow is between:
1 000 - 3% = 970 kg/h
And
1 000 + 3% = 1 030 kg/h
Similarly, at an indicated flowrate of 500 kg/h, the error is still ±3%, and the ‘uncertainty’ is between:
500 kg/h - 3% = 485 kg/h
And
500 kg/h + 3% = 515 kg/h
• Percentage of full scale deflection (FSD)
A flowmeter’s accuracy may also be given as a percentage of full scale deflection FSD, which means that the measurement error is expressed as a percentage of the maximum flow that the flowmeter can handle. Error stated in percentage FSD tends to be smaller than the error as a percentage of actual reading. For this example a value of ±0.3% FSD will be used.
As in the previous case, the maximum flow = 1 000 kg/h.
At an indicated flowrate of 1 000 kg/h, the ‘uncertainty’ of actual flow is between:
1 000 kg/h - 0.3% = 997 kg/h
And
1 000 kg/h + 0.3% = 1 003 kg/h
50 kg/h + 3 kg/h = 53 kg/h an error of +6%
As the flowrate is reduced, the percentage error increases.
A comparison of these measurement terms is shown graphically in Figure 4.2.1
Figure 4.2.1 demonstrates why flowmeter manufacturers state their accuracy as a combination of both a percentage of FSD and actual reading. In this example ±3% of reading is more accurate below a flowrate of 100 kg/h, however, as the flowrate increases beyond 100 kg/h, then ±0.3% of FSD gives a more accurate result in terms of actual flowrate.
Turndown
When specifying a flowmeter, accuracy is a necessary requirement, but it is also essential to select a flowmeter with sufficient range for the application.
‘Turndown’ or ‘turndown ratio’, ‘effective range’ or ‘rangeability’ are all terms used to describe the range of flowrates over which the flowmeter will work within the accuracy and repeatability of the tolerances. Turndown is qualified in Equation 4.2.1.
Example 4.2.1
A particular steam system has a demand pattern as shown in Figure 4.2.2 The flowmeter has been sized to meet the maximum expected flowrate of 1 000 kg/h.
The turndown of the flowmeter selected is given as 4:1. i.e. The claimed accuracy of the flowmeter can be met at a minimum flowrate of 1 000 ÷ 4 = 250 kg/h.
When the steam flowrate is lower than this, the flowmeter cannot meet its specification, so large flow errors occur. At best, the recorded flows below 250 kg/h are inaccurate - at worst they are not recorded at all, and are ‘lost’.
In the example shown in Figure 4.2.2, ‘lost flow’ is shown to amount to more than 700 kg of steam over an 8 hour period. The total amount of steam used during this time is approximately 2 700 kg, so the ‘lost’ amount represents an additional 30% of total steam use. Had the steam flowmeter been specified with an appropriate turndown capability, the steam flow to the process could have been more accurately measured and costed.
- If steam flow is to be accurately metered, the user must make every effort to build up a true and complete assessment of demand, and then specify a flowmeter with:The capacity to meet maximum demand.
- A turndown sufficiently large to encompass all anticipated flow variations.
Bernoulli’s Theorem
Many flowmeters are based on the work of Daniel Bernoulli in the 1700s. Bernoulli’s theorem relates to the Steady Flow Energy Equation (SFEE), and states that the sum of:
- Pressure energy,
- Kinetic energy and
- Potential energy
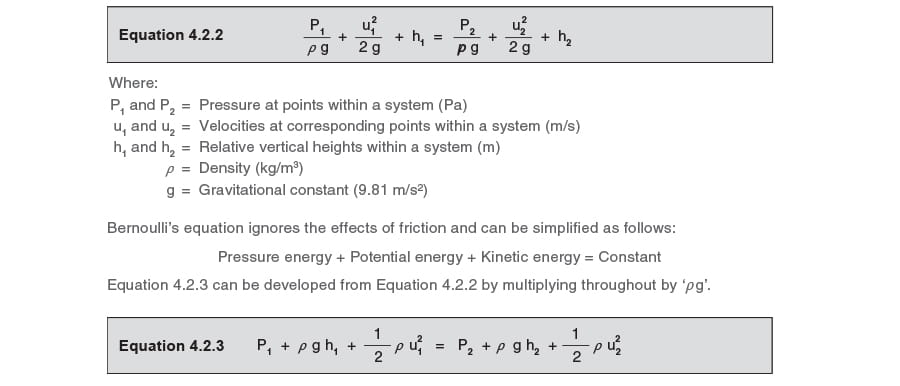
will be constant at any point within a piping system (ignoring the overall effects of friction). This is shown below, mathematically in Equation 4.2.2 for a unit mass flow:
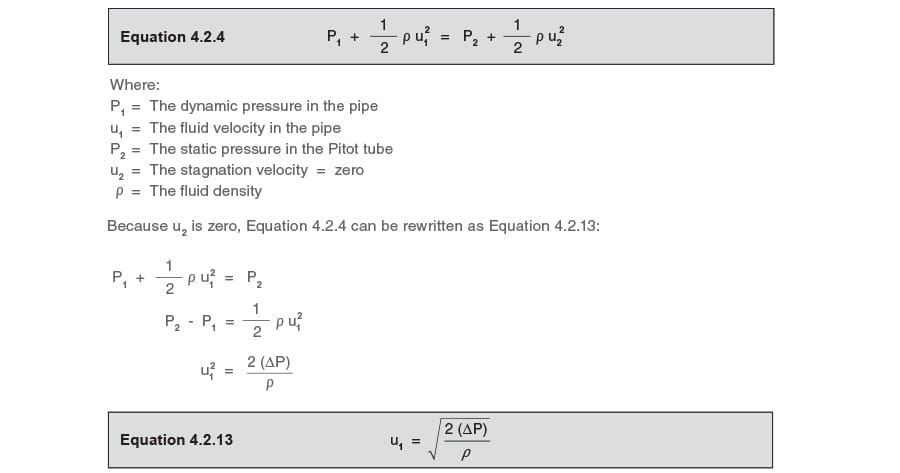
Friction is ignored in Equations 4.2.2 and 4.2.3, due to the fact that it can be considered negligible across the region concerned. Friction becomes more significant over longer pipe lengths. Equation 4.2.3 can be further developed by removing the 2nd term on either side when there is no change in reference height (h). This is shown in Equation 4.2.4:
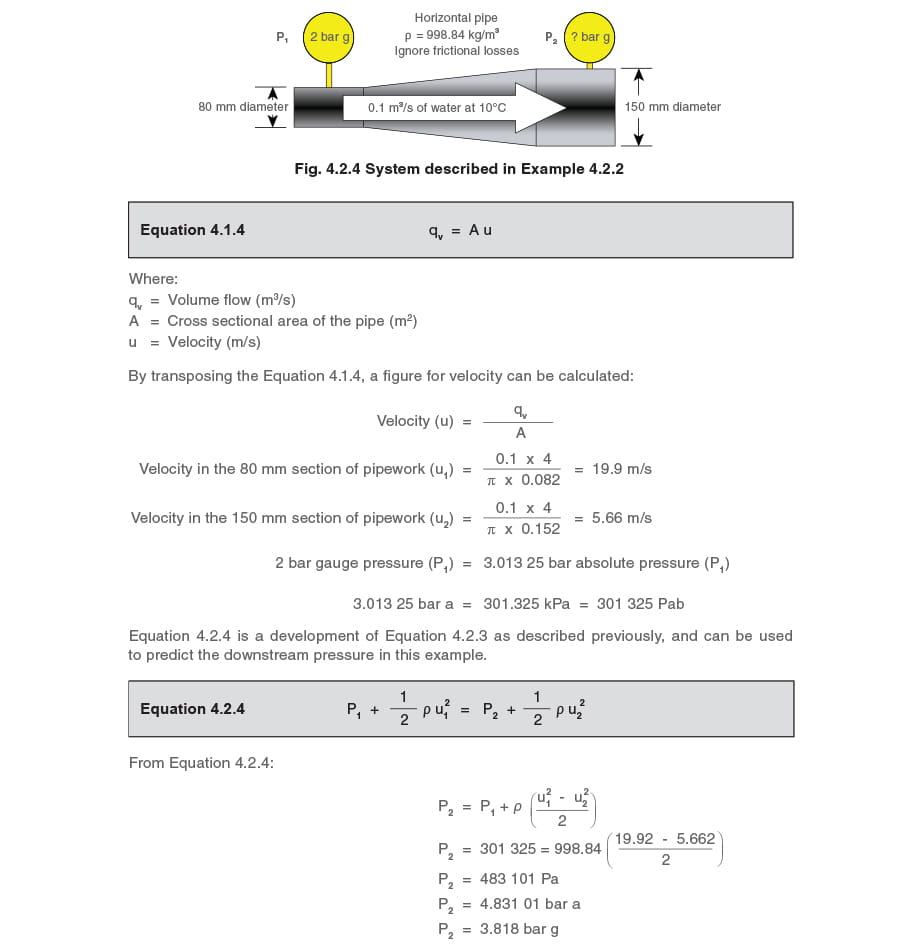
Example 4.2.2
Determine P2 for the system shown in Figure 4.2.4, where water flows through a diverging section of pipe at a volumetric rate of 0.1 m3/s at 10°C.
The water has a density of 998.84 kg/m3 at 10°C and 2 bar g.
Example 4.2.2 highlights the implications of Bernoulli’s theorem. It is shown that, in a diverging pipe, the downstream pressure will be higher than the upstream pressure. This may seem odd at first glance; it would normally be expected that the downstream pressure in a pipe is less than the upstream pressure for flow to occur in that direction. It is worth remembering that Bernoulli states, the sum of the energy at any point along a length of pipe is constant.
In Example 4.2.2, the increased pipe bore has caused the velocity to fall and hence the pressure to rise. In reality, friction cannot be ignored, as it is impossible for any fluid to flow along a pipe unless a pressure drop exists to overcome the friction created by the movement of the fluid itself. In longer pipes, the effect of friction is usually important, as it may be relatively large. A term, hf, can be added to Equation 4.2.4 to account for the pressure drop due to friction, and is shown in Equation 4.2.5.
With an incompressible fluid such as water flowing through the same size pipe, the density and velocity of the fluid can be regarded as constant and Equation 4.2.6 can be developed from Equation 4.25 P1=P2+hf
Equation 4.2.6 shows (for a constant fluid density) that the pressure drop along a length of the same size pipe is caused by the static head loss (hf) due to friction from the relative movement between the fluid and the pipe. In a short length of pipe, or equally, a flowmetering device, the frictional forces are extremely small and in practice can be ignored. For compressible fluids like steam, the density will change along a relatively long piece of pipe. For a relatively short equivalent length of pipe (or a flowmeter using a relatively small pressure differential), changes in density and frictional forces will be negligible and can be ignored for practical purposes. This means that the pressure drop through a flowmeter can be attributed to the effects of the known resistance of the flowmeter rather than to friction.
Some flowmeters take advantage of the Bernoulli effect to be able to measure fluid flow, an example being the simple orifice plate flowmeter. Such flowmeters offer a resistance to the flowing fluid such that a pressure drop occurs over the flowmeter. If a relationship exists between the flow and this contrived pressure drop, and if the pressure drop can be measured, then it becomes possible to measure the flow.
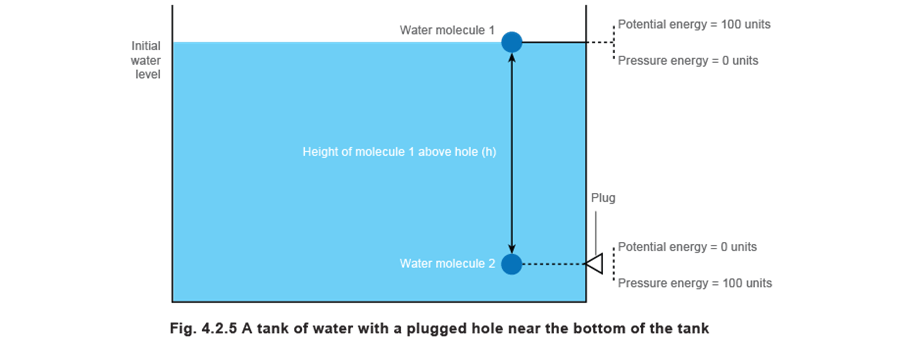
Quantifying the relationship between flow and pressure drop Consider the simple analogy of a tank filled to some level with water, and a hole at the side of the tank somewhere near the bottom which, initially, is plugged to stop the water from flowing out (see Figure 4.2.5). It is possible to consider a single molecule of water at the top of the tank (molecule 1) and a single molecule below at the same level as the hole (molecule 2).
With the hole plugged, the height of water (or head) above the hole creates a potential to force the molecules directly below molecule 1 through the hole. The potential energy of molecule 1 relative to molecule 2 would depend upon the height of molecule 1 above molecule 2, the mass of molecule 1, and the effect that gravitational force has on molecule 1’s mass. The potential energy of all the water molecules directly between molecule 1 and molecule 2 is shown by Equation 4.2.7.
4.2.7.Equation 4.2.7.
Molecule 1 has no pressure energy (the nett effect of the air pressure is zero, because the plug at the bottom of the tank is also subjected to the same pressure), or kinetic energy (as the fluid in which it is placed is not moving). The only energy it possesses relative to the hole in the tank is potential energy.
Meanwhile, at the position opposite the hole, molecule 2 has a potential energy of zero as it has no height relative to the hole. However, the pressure at any point in a fluid must balance the weight of all the fluid above, plus any additional vertical force acting above the point of consideration. In this instance, the additional force is due to the atmospheric air pressure above the water surface, which can be thought of as zero gauge pressure. The pressure to which molecule 2 is subjected is therefore related purely to the weight of molecules above it.
Weight is actually a force applied to a mass due to the effect of gravity, and is defined as mass x acceleration. The weight being supported by molecule 2 is the mass of water (m) in a line of molecules directly above it multiplied by the constant of gravitational acceleration, (g). Therefore, molecule 2 is subjected to a pressure force m g.
But what is the energy contained in molecule 2? As discussed above, it has no potential energy; neither does it have kinetic energy, as, like molecule 1, it is not moving. It can only therefore possess pressure energy.
Mechanical energy is clearly defined as Force x Distance,
so the pressure energy held in molecule 2 = Force (m g) x Distance (h) = m g h, where:
m = Mass of all the molecules directly between and including molecule 1 and molecule 2
g = Gravitational acceleration 9.81 m/s2
h = Cumulative height of molecules above the hole
It can therefore be seen that:
Potential energy in molecule 1 = m g h = Pressure energy in molecule 2.
This agrees with the principle of conservation of energy (which is related to the First Law of Thermodynamics) which states that energy cannot be created or destroyed, but it can change from one form to another. This essentially means that the loss in potential energy means an equal gain in pressure energy.
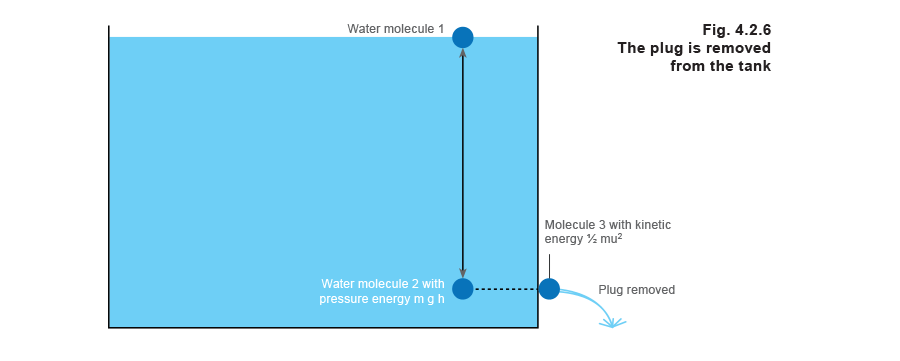
Consider now, that the plug is removed from the hole, as shown in Figure 4.2.6. It seems intuitive that water will pour out of the hole due to the head of water in the tank.
In fact, the rate at which water will flow through the hole is related to the difference in pressure energy between the molecules of water opposite the hole, inside and immediately outside the tank. As the pressure outside the tank is atmospheric, the pressure energy at any point outside the hole can be taken as zero (in the same way as the pressure applied to molecule 1 was zero). Therefore the difference in pressure energy across the hole can be taken as the pressure energy contained in molecule 2, and therefore, the rate at which water will flow through the hole is related to the pressure energy of molecule 2.
In Figure 4.2.6, consider molecule 2 with pressure energy of m g h, and consider molecule 3 having just passed through the hole in the tank, and contained in the issuing jet of water.
Molecule 3 has no pressure energy for the reasons described above, or potential energy (as the fluid in which it is placed is at the same height as the hole). The only energy it has can only be kinetic energy.
At some point in the water jet immediately after passing through the hole, molecule 3 is to be found in the jet and will have a certain velocity and therefore a certain kinetic energy. As energy cannot be created, it follows that the kinetic energy in molecule 3 is formed from that pressure energy held in molecule 2 immediately before the plug was removed from the hole.
It can therefore be concluded that the whole of the kinetic energy held in molecule 3 equals the pressure energy to which molecule 2 is subjected, which, in turn, equals the potential energy held in molecule 1.
The basic equation for kinetic energy is shown in Equation 4.2.8:
If all the initial potential energy has changed into kinetic energy, it must be true that the potential energy at the start of the process equals the kinetic energy at the end of the process. To this end, it can be deduced that:
Equation 4.2.10 shows that the velocity of water passing through the hole is proportional to the square root of the height of water or pressure head (h) above the reference point, (the hole). The head ‘h’ can be thought of as a difference in pressure, also referred to as pressure drop or ‘differential pressure’.
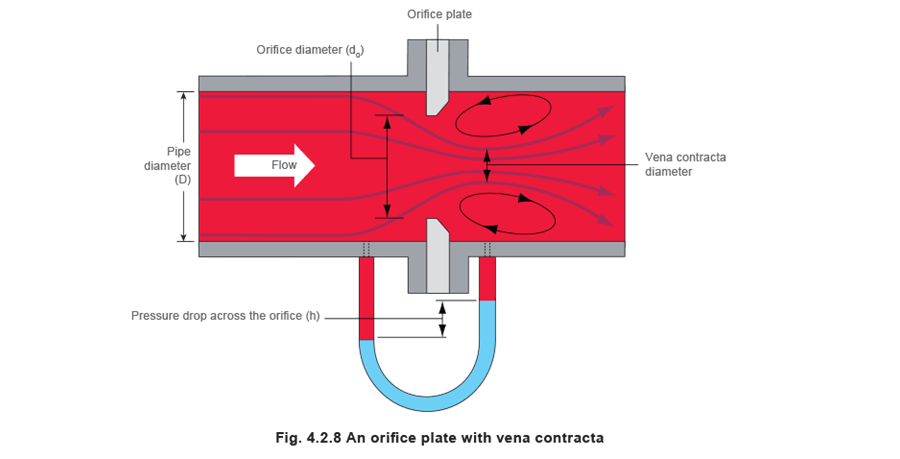
Equally, the same concept would apply to a fluid passing through an orifice that has been placed in a pipe. One simple method of metering fluid flow is by introducing an orifice plate flowmeter into a pipe, thereby creating a pressure drop relative to the flowing fluid. Measuring the differential pressure and applying the necessary square-root factor can determine the velocity of the fluid passing through the orifice.
The graph (Figure 4.2.7) shows how the flowrate changes relative to the pressure drop across an orifice plate flowmeter. It can be seen that, with a pressure drop of 25 kPa, the flowrate is the square root of 25, which is 5 units. Equally, the flowrate with a pressure drop of 16 kPa is 4 units, at 9 kPa is 3 units and so on.
Knowing the velocity through the orifice is of little use in itself. The prime objective of any flowmeter is to measure flowrate in terms of volume or mass. However, if the size of the hole is known, the volumetric flowrate can be determined by multiplying the velocity by the area of the hole. However, this is not as straightforward as it first seems.
It is a phenomenon of any orifice fitted in a pipe that the fluid, after passing through the orifice, will continue to constrict, due mainly to the momentum of the fluid itself. This effectively means that the fluid passes through a narrower aperture than the orifice. This aperture is called the ‘vena contracta’ and represents that part in the system of maximum constriction, minimum pressure, and maximum velocity for the fluid. The area of the vena contracta depends upon the physical shape of the hole, but can be predicted for standard sharp edged orifice plates used for such purposes. The ratio of the area of the vena contracta to the area of the orifice is usually in the region of 0.65 to 0.7; consequently if the orifice area is known, the area of the vena contracta can be established. The subject is discussed in further detail in the next Section.
Section.next Section.
The orifice plate flowmeter and Bernoulli’s Theorem
When Bernoulli’s theorem is applied to an orifice plate flowmeter, the difference in pressure across the orifice plate provides the kinetic energy of the fluid discharged through the orifice.
As seen previously, the velocity through the orifice can be calculated by use of Equation 4.2.10:
However, it has already been stated, volume flow is more useful than velocity (Equation 4.1.4):
In practice, the actual velocity through the orifice will be less than the theoretical value for velocity, due to friction losses. This difference between these theoretical and actual figures is referred to as the coefficient of velocity (CV)
Also, the flow area of the vena contracta will be less than the size of the orifice. The ratio of the area of the vena contracta to that of the orifice is called the coefficient of contraction

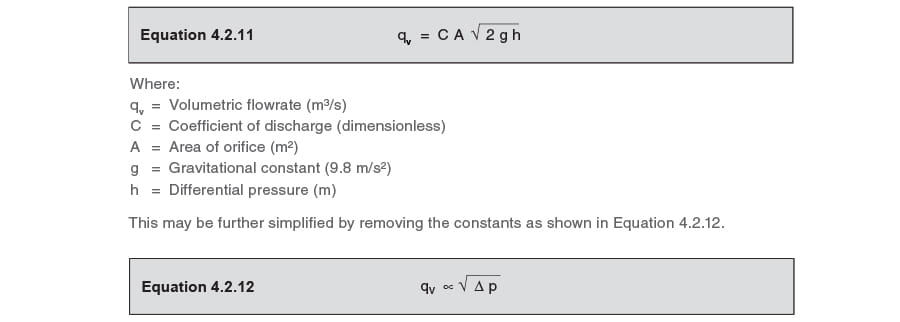
The coefficient of velocity and the coefficient of contraction may be combined to give a coefficient of discharge (C) for the installation. Volumetric flow will need to take the coefficient of discharge (C) into consideration as shown in Equation 4.2.11.
Equation 4.2.12 clearly shows that volume flowrate is proportional to the square root of the pressure drop.
Note:
The definition of C can be found in ISO 5167-2003, ‘Measurement of fluid flow by means of pressure differential devices inserted in circular cross-section conduits running full’.
ISO 5167 offers the following information:
The equations for the numerical values of C given in ISO 5167 (all parts) are based on data determined experimentally.
The uncertainty in the value of C can be reduced by flow calibration in a suitable laboratory.
laboratory.suitable laboratory.
The Pitot tube and Bernoulli’s Theorem
The Pitot tube is named after its French inventor Henri Pitot (1695 – 1771). The device measures a fluid velocity by converting the kinetic energy of the flowing fluid into potential energy at what is described as a ‘stagnation point’. The stagnation point is located at the opening of the tube as in Figure 4.2.9. The fluid is stationary as it hits the end of the tube, and its velocity at this point is zero. The potential energy created is transmitted though the tube to a measuring device.
The tube entrance and the inside of the pipe in which the tube is situated are subject to the same dynamic pressure; hence the static pressure measured by the Pitot tube is in addition to the dynamic pressure in the pipe. The difference between these two pressures is proportional to the fluid velocity, and can be measured simply by a differential manometer.

Bernoulli’s equation can be applied to the Pitot tube in order to determine the fluid velocity from the observed differential pressure (ΔP) and the known density of the fluid. The Pitot tube can be used to measure incompressible and compressible fluids, but to convert the differential pressure into velocity, different equations apply to liquids and gases. The details of these are outside the scope of this module, but the concept of the conservation of energy and Bernoulli’s theorem applies to all; and for the sake of example, the following text refers to the relationship between pressure and velocity for an incompressible fluid flowing at less than sonic velocity. (Generally, a flow can be considered incompressible when its flow is less than 0.3 Mach or 30% of its sonic velocity).
From Equation 4.2.4, an equation can be developed to calculate velocity (Equation 4.2.13):
The fluid volumetric flowrate can be calculated from the product of the pipe area and the velocity calculated from Equation 4.2.13.
The effect of the accuracy of the differential cell upon uncertainty
Example 4.2.3
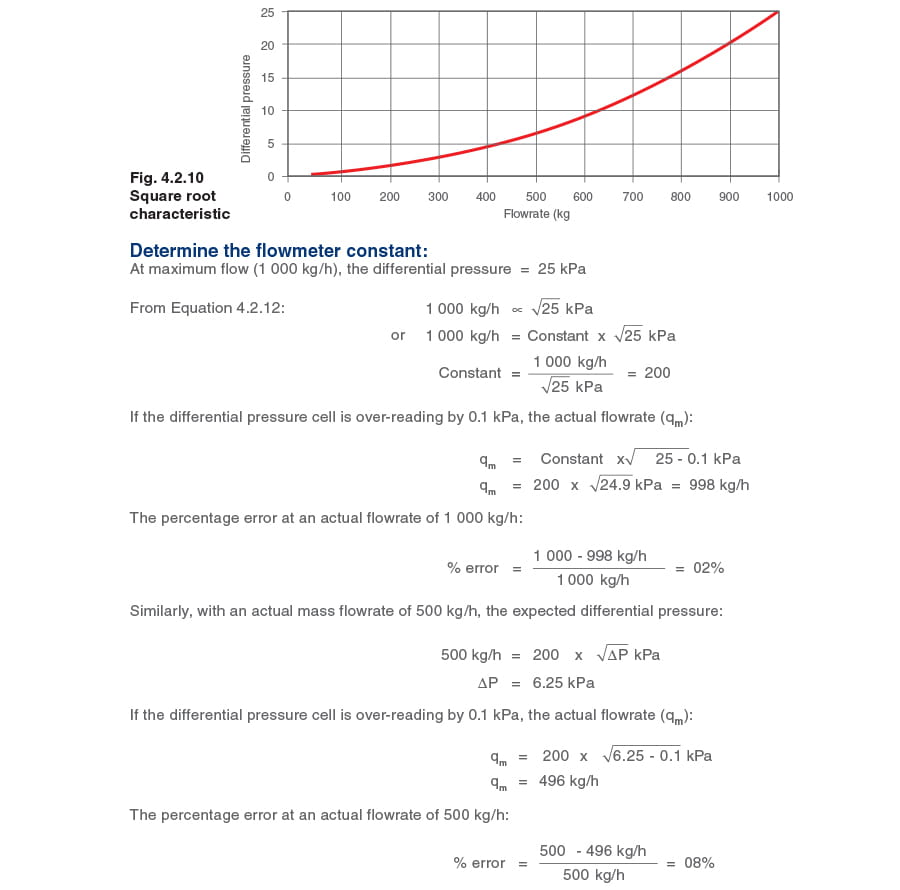
In a particular orifice plate flowmetering system, the maximum flow of 1 000 kg/h equates to a differential pressure of 25 kPa, as shown in Figure 4.2.10.
The differential pressure cell has a guaranteed accuracy of ±0.1 kPa over the operating range of a particular installation.
Demonstrate the effect of the differential cell accuracy on the accuracy of the installation.
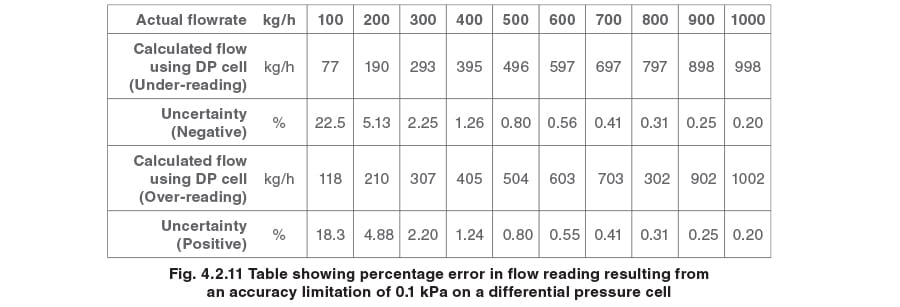
Figure 4.2.11 shows the effects over a range of flowrates:
Review of results:
At maximum flowrate, the 0.1 kPa uncertainty in the differential pressure cell reading represents only a small proportion of the total differential pressure, and the effect is minimal.
As the flowrate is reduced, the differential pressure is also reduced, and the 0.1 kPa uncertainty represents a progressively larger percentage of the differential pressure reading, resulting in the slope increasing slowly, as depicted in Figure 4.2.12.
At very low flowrates, the value of the uncertainty accelerates. At between 20 and 25% of maximum flow, the rate of change of the slope accelerates rapidly, and by 10% of maximum flow, the range of uncertainty is between + 18.3% and -22.5%.
Conclusion
To have confidence in the readings of an orifice plate flowmeter system, the turndown ratio must not exceed 4 or 5:1.
Note:
• Example 4.2.3 examines only one element of a steam flowmetering installation.
• The overall confidence in the measured value given by a steam flowmetering system will include the installation, the accuracy of the orifice size, and the accuracy of the predicated coefficient of discharge (C) of the orifice.
Using ultrasound to measure flowrate
Using ultrasound to measure flowrates in a pipe is becoming more popular as it requires no cutting or inserting instrumentation into the pipework of the fluid being monitored. It also means that the flowmeter can be portable and used on different parts of the system to analyse flowrates with minimal expense.
There are two types of ultrasonic flowmeter - the transit-time or Doppler-shift type. The most common ultrasonic flowmeters tend to use the transit-shift principle of operation, which is described below:
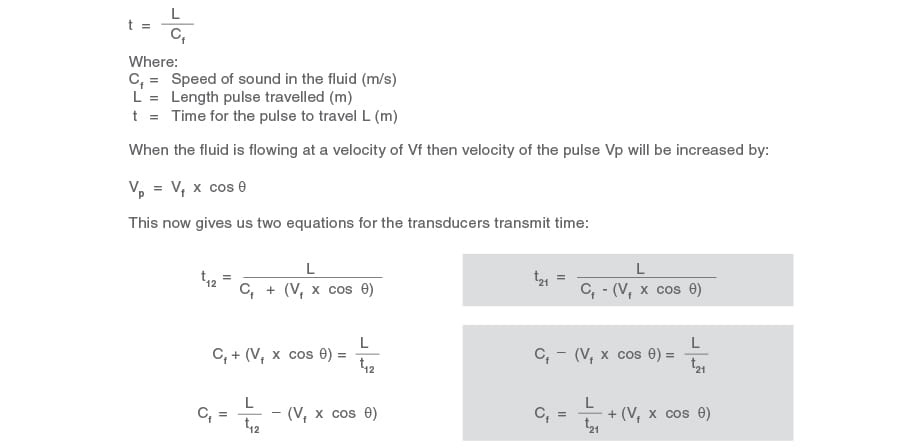
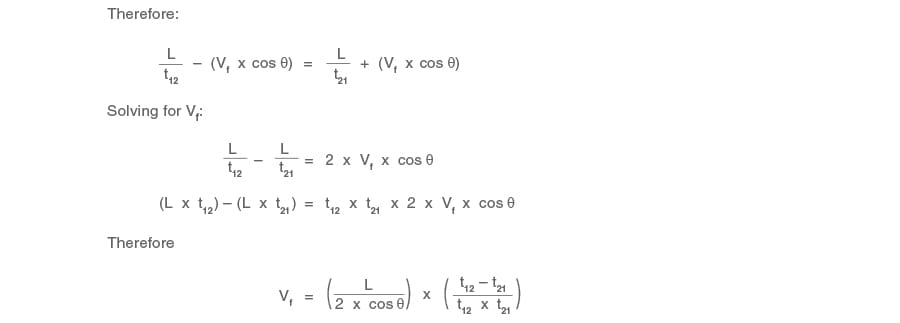
Two transducers are strapped to the pipe of the fluid being measured where each transducer alternatively fires pulses of ultrasound between each other as shown in Figure 4.2.13. The velocity of the fluid flowing through the pipe will have an effect on the velocity of the ultrasonic pulse, which is calculated by measuring the time it takes for the pulses to reach each transducer.

When flow velocity is zero, the time it takes for a pulse to travel from one transmitter to the other is:
By knowing the cross sectional area of the pipe and the fluid velocity, volumetric flow can be easily calculated, together with mass flow, using the equations below:
Qv = Vf x A
m = Qv x ρ
Where:
Qv = Volumetric flowrate (m3)
A = Cross sectional area of the pipe (m2)
Vf = Velocity of fluid (m/s)
ρ = Density of fluid (kg/m3)
Although ultrasound has some very significant benefits over other principles of flow metering, it can only be accurately used on single phase fluids. Therefore the presence of flash steam or air, for example, in a condensate return line will significantly affect the accuracy of the reading.


